Draw animated chart on React Native
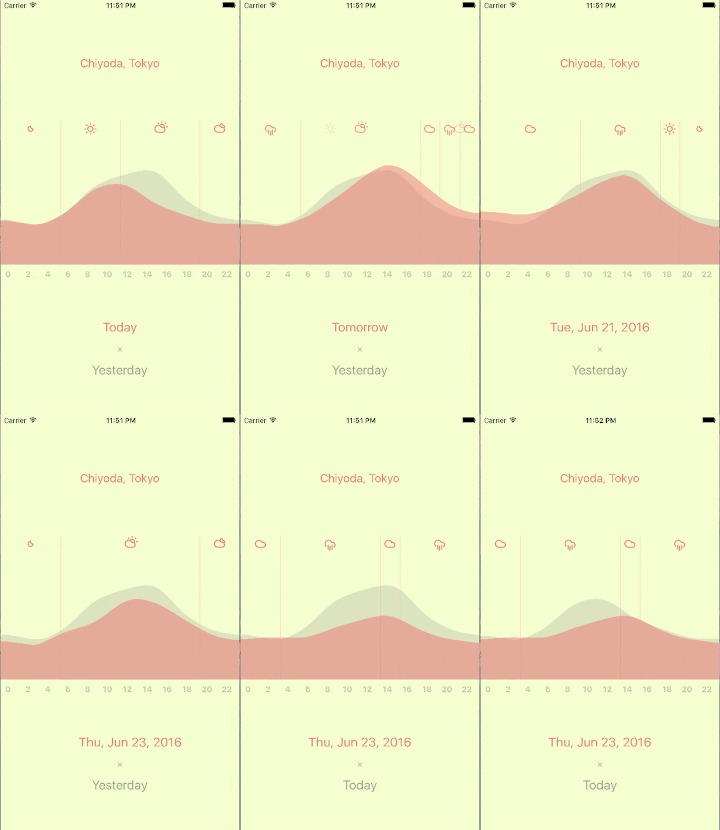
At Meguro.es #4 on June 21th, 2016, I talked about drawing animated chart on React Native. The talk was about the things I learned through developing an tiny app, Compare. It's a super simple app to compare temperatures.
Before creating it, I had no idea about what temperatures on weather forecast, like 15 degrees Celsius, were actually like. I remember what yesterday was like, but not the numbers. Typical weather forecast apps shows only future temperatures without past records. Thanks to The Dark Sky Forecast API, the app fetches both of past records and future forecasts, and show them together.

The app's source code is on GitHub:
There might have been some charting libraries to draw similar charts, but I like to write things from scratch. I like to reinvent the wheel especially when it's a side project. Thanks to that, I found a way to animate smooth paths with the Animated library.
If I have to add something to the slides:
- It's fun to develop on React Native, and super easy to start. If you know React and CSS, you can apply your familiar ideas to mobile app development. And they are actually powerful.
- Jason Brown's JavaScript without Grammar is an awesome blog. It has lots of articles about React Native and animation on it, which taught me a lot. Also, I found the awesomeness of
LayoutAnimationat Justin Poliachik's React Native’s LayoutAnimation is Awesome, which is a great post too.