Node.js under a microscope: CPU FlameGraph and FlameScope
Last week, I had an opportunity to talk about profiling Node.js applications on production at an internal guild meeting at work. Here is a written version of it plus some additional information.
Background
I have been working on Node.js microservices, which fetch data from API servers and render HTML with React, at work. We monitor response times at load balancers, in application metrics and with distributed tracing with OpenTracing. One of the microservices had a weird gap between 99 percentile response times of itself and its dependencies. It was spending an extra 500 milliseconds—but I didn't know why.
My first suspect was the network. It is the place full of uncertainty. After learning and trying different commands and metrics, I took tcpdump and checked packets one by one with my eyes and a script. There were no significant delays that I had expected. So I had to stop blaming the network—or someone else.
CPU profiling with the Linux perf command
Because the weird latency was happening in the application itself, I wanted to know what's going on in it. There are mainly two ways to achieve this: profiling and tracing. Profiling records some samples and tracing records everything. I wanted to do it on production, so profiling was naturally a good fit because of its smaller overhead.
For Node.js, there are mainly two different tools. One is V8 profiler, and the other is Linux perf. V8 profiler uses the profiler provided by V8. It covers all JavaScript executions and V8 native functions. It works on non-Linux operating systems. If you use non-Linux machines, it might be pretty handy. On the other hand, Linux perf can profile almost anything including Linux kernel, libuv, and all processes on your OS with minimal overhead. However, as the name suggests, it works only on Linux. According to Node CPU Profiling Roadmap, it seems that V8 profiler is the one officially supported by the V8 team, but Linux perf will keep working for a while. After all, I picked Linux perf because of low performance-overhead and small intervention to applications.
Linux perf record records stack traces into a binary file called perf.data by default. The binary file has only addresses and file names of functions. perf script converts the stack traces into a human-readable text file adding function names from program binaries and symbol map files.
# Install dependencies for `perf` command
sudo apt-get install linux-tools-common linux-tools-$(uname -r)
# Test `perf` command
sudo perf top

# Record stack traces 99 times per second for 30 seconds
sudo perf record -F 99 -p ${pid} -g -- sleep 30s
# Generate human readable stack traces
sudo perf script > stacks.${pid}.out
Now we have human-readable stack traces, but it's still hard to browse thousands of stack traces and get insights from them. How can we efficiently analyze them?
CPU Flame Graph
CPU Flame Graph by Brendan Gregg is a great way of visualizing stack traces. It aggregates stack traces into one chart. Frequently executed functions are shown wider and rarely executed functions are narrower in the chart.
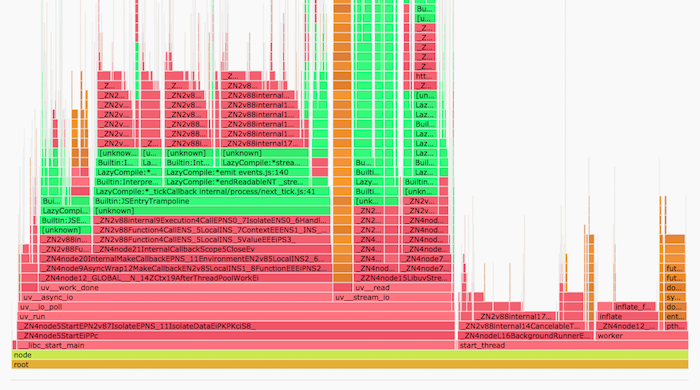
I found some insights about the application on production with CPU Flame Graph:
- React server-side rendering is considered to be a very CPU-intensive task that blocks Node.js event loop. However,
JSON.parse()was using 3x more CPU than React—it might be because we had already optimized React server-side rendering though. - Gzip decompression was using the almost same amount of CPU as React server-side rendering.
There are a few tools like FlameGraph and 0x to generate CPU Flame Graph from Linux perf stack traces. However, I eventually didn't need them because FlameScope, which I'll explain next, can generate CPU Flame Graph too.
FlameScope
FlameScope by Netflix is another great tool for visualizing stack traces in a time-series. It shows a heatmap out of stack traces. Each cell represents a short amount of time, 20 ms if 50 cells per second, and its color represents how many times the process was on-CPU. It visualizes patterns of your application's activity.
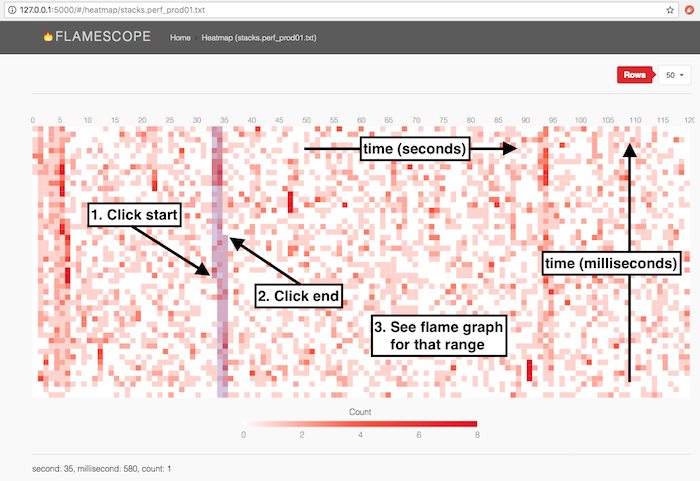
If you select a time range on the heatmap, FlameScope shows you a CPU Flame Graph of the range. It allows you to examine what happened when in details.
To use FlameScope, check out the repository and run the python server. Then put stack trace files from perf script into examples directory, and open http://localhost:5000.
I found a couple of exciting insights about the application on production using this tool.
Example 1: Heavy tasks in the master process
The application used the cluster module to utilize multiple CPU cores. FlameScope showed that the master process was not busy for most of the time, but it occasionally kept using CPU for 1.5 seconds continuously! FlameScope showed that it was caused by metrics aggregation.
The master process was aggregating application metrics from worker processes, and it was responding to metrics collectors a few times in a minute. When the metrics collectors asked for data, the master process calculated percentiles of response times and prepared a JSON response. The percentile calculation was taking long time because the application had a lot of metrics buckets and the library that we used was using JSON.stringify() and JSON.parse() to deep-copy objects!
Example 2: Frequent garbage collections
FlameScope showed that the worker processes were not overloaded for most of the time, but they had a few hundred milliseconds of CPU-busy time in about 10 seconds. It was caused by mark-sweep and mark-compact garbage collections.
The application had an in-memory fallback cache for API calls that was used only when API calls and retries fail. Even when API had problems, the cache hit rate was very low because of the number of permutations. In other words, it was not used almost at all. It cached large API responses for a while and threw them away after the cache expired. It looked innocent at first glance—but it was a problem for V8's generational garbage collector.
The API responses were always promoted to the old generation space causing frequent slow GCs. GC of the old generation is much slower than GC of the young generation. After removing the fallback cache, the application's 99 percentile response time improved by hundreds of milliseconds!
Node.js gotchas
perf script collects symbols for function addresses from program binaries. For Node.js, we need something special because functions are compiled just in time. As far as I know, there are two ways to record symbols:
- Run your Node.js process with
--perf-basic-prof-only-functionsoption. It generates a log file at/tmp/perf-${pid}.map. The file keeps growing. The speed depends on your application, but it was a few megabytes per day for an application at work. Another problem is that functions in V8 keep moving and the addresses in/tmp/perf-${pid}.mapget outdated. I wrote a script to fix the issue. - Use mmarchini/node-linux-perf. It generates the same
/tmp/perf-${pid}.mapas--perf-basic-prof-only-functionsdoes, but on demand. Because it always freshly generates the file, it doesn't contain outdated symbols. It seems to be the way to go, but I haven't tried this on production yet.
In addition to the above, there are a few more Node.js options that you can use to improve your stack traces—though I haven't tried them on production because the stack traces were already good enough for me:
--no-turbo-inliningturns off function inlining, which is an optimization done by V8. Because function inlining fuses multiple functions into one, it can make it harder to understand stack traces. Turning it off generates more named frames.--interpreted-frames-native-stackfixesBuiltin:InterpereterEntryTrampolinein stack traces. It is available from Node.js 10.4.0. Check out "Interpreted Frames" in Updates from the Diagnostics Summit for more details.
Docker gotchas
It gets a bit tricky when you are using containers to run your application. There are two ways to use Linux perf with Docker:
- Run
perf recordandperf scriptin the same Docker container as your application is running - Run
perf recordandperf scriptin the host OS
I eventually chose the option 2. I tried the option 1 first but gave up because I was using Alpine Linux as the base image and it was hard to make Linux perf available on it.
To run perf record in the host OS, we need to figure out pid of the application process in the host.
$ ps ax | grep -n 'node --perf'
21574 pts/0    Sl+    2:53 node --perf-basic-prof-only-functions src/index.js
30481 pts/3    S+     0:00 grep --color=auto node --perf
# or
$ pgrep -f 'node --perf'
21574

$ sudo perf record -F 99 -p 21574 -g -- sleep 30s
perf script collects symbols from binaries and symbol files to get human-readable function names. It needs to be able to read the binaries whose functions were recorded with perf script and /tmp/${pid}.map files that applications generate. However, perf script in the host OS cannot read them with the same file names as the container can. (It seems that this is not the case anymore with the latest Linux kernel because its perf command knows containers. But it was the case for me because I was not using the latest kernel.)
I learned how to overcome the issue from Making FlameGraphs with Containerized Java. I just copied necessary files from the container to the host.
# Horrible hack! Binaries to be used depend on your set up. `perf script` tells you what it wants if anything is missing.
sudo docker cp mycontainer:/usr/bin/node /usr/bin/node
sudo docker cp mycontainer:/lib/ld-musl-x86_64.so.1 /lib/ld-musl-x86_64.so.1
sudo docker cp mycontainer:/usr/lib/libstdc++.so.6.0.22 /usr/lib/libstdc++.so.6.0.22
To copy symbol map files, we need to find the pid in the container. We can do it by checking /proc/${host_pid}/status.
$ cat /proc/21574/status | grep NSpid
NSpid:  21574   6
$ sudo docker cp mycontainer:/tmp/perf-6.map /tmp/perf-21574.map
Now everything is ready! Then we can use perf script as usual.
sudo perf script > stacks.${pid}.out
I set up a sample project for profiling a Node.js application on Docker. It was nice to practice profiling a bit before doing it on production!
Conclusion
Linux perf provides great observability to Node.js applications on production. Tools like CPU Flame Graph and FlameScope helped me to identify performance bottlenecks.
There are some gotchas to profile Node.js applications on Docker with Linux perf. It took some time for me to figure out how to do it because Node.js and Linux evolve day by day and I couldn't find many up-to-date resources online. I hope this post is helpful!